はじめに
近年、日本の温泉や銭湯への関心が再び高まっています。リラクゼーションや健康維持を目的に利用する方も増え、観光資源としても重要な位置を占めています。そこで今回は、Google Maps APIを活用して全国の温泉・銭湯データを収集し、その分布を視覚的に分析してみました。

データ収集方法
データ収集には Google Places API を利用しました。47都道府県それぞれで「温泉」と「銭湯」というキーワードで検索し、位置情報、名称、評価、営業時間、連絡先などの情報を取得しています。
コード解説: データ収集
データ収集の核となるコードを簡単に解説します。Google Colabで実行できるよう設計しています。
import requests
import pandas as pd
import time
import os
import json
from datetime import datetime
from google.colab import auth
from google.auth import default

# Google Places API の初期設定
def setup_google_api():
    # Google Colab で認証を行う
    auth.authenticate_user()
    creds, _ = default()

    # Google Cloud プロジェクトで API キーを取得する必要があります
    # この変数に API キーを設定してください
    API_KEY = ""
    return API_KEY

# 都道府県のリスト
PREFECTURES = [
    "北海道", "青森県", "岩手県", "宮城県", "秋田県", "山形県", "福島県",
    "茨城県", "栃木県", "群馬県", "埼玉県", "千葉県", "東京都", "神奈川県",
    "新潟県", "富山県", "石川県", "福井県", "山梨県", "長野県", "岐阜県",
    "静岡県", "愛知県", "三重県", "滋賀県", "京都府", "大阪府", "兵庫県",
    "奈良県", "和歌山県", "鳥取県", "島根県", "岡山県", "広島県", "山口県",
    "徳島県", "香川県", "愛媛県", "高知県", "福岡県", "佐賀県", "長崎県",
    "熊本県", "大分県", "宮崎県", "鹿児島県", "沖縄県"
]

# 中間ファイルの保存先ディレクトリ
CACHE_DIR = "./onsen_cache"

# キャッシュディレクトリを作成
def ensure_cache_dir():
    if not os.path.exists(CACHE_DIR):
        os.makedirs(CACHE_DIR)

# Google Places API を使って温泉施設を検索する関数
def search_onsen_places(api_key, prefecture, keyword="温泉", max_results=20):
    cache_file = os.path.join(CACHE_DIR, f"{prefecture}_{keyword}_search.json")

    # キャッシュがあれば読み込む
    if os.path.exists(cache_file):
        with open(cache_file, 'r', encoding='utf-8') as f:
            print(f"{prefecture}の{keyword}検索結果をキャッシュから読み込みます")
            return json.load(f)

    all_results = []
    next_page_token = None

    # 最初のリクエスト
    base_url = "https://maps.googleapis.com/maps/api/place/textsearch/json"
    params = {
        "query": f"{keyword} {prefecture}",
        "language": "ja",
        "key": api_key
    }

    # 結果が複数ページにわたる場合の処理
    for page in range(3):  # 最大3ページまで取得
        if next_page_token:
            params["pagetoken"] = next_page_token
            # ページトークンを使用する場合、APIの仕様上少し待機が必要
            time.sleep(2)

        try:
            print(f"{prefecture}の{keyword}を検索中... ページ {page+1}/3")
            response = requests.get(base_url, params=params)
            data = response.json()

            if response.status_code != 200 or "results" not in data:
                print(f"エラー: {prefecture} の検索に失敗しました")
                print(data)
                # リクエスト制限に達した場合は待機
                if "status" in data and data["status"] == "OVER_QUERY_LIMIT":
                    print("API制限に達しました。60秒待機します...")
                    time.sleep(60)
                    continue
                break

            all_results.extend(data["results"])

            if "next_page_token" in data:
                next_page_token = data["next_page_token"]
            else:
                break

            if len(all_results) >= max_results:
                break

            # ページ間で待機して制限を回避
            time.sleep(3)

        except Exception as e:
            print(f"エラーが発生しました: {str(e)}")
            time.sleep(10)  # エラー時は長めに待機

    # キャッシュに保存
    with open(cache_file, 'w', encoding='utf-8') as f:
        json.dump(all_results[:max_results], f, ensure_ascii=False, indent=2)

    return all_results[:max_results]

# 詳細情報を取得する関数
def get_place_details(api_key, place_id):
    cache_file = os.path.join(CACHE_DIR, f"details_{place_id}.json")

    # キャッシュがあれば読み込む
    if os.path.exists(cache_file):
        with open(cache_file, 'r', encoding='utf-8') as f:
            print(f"Place ID {place_id} の詳細情報をキャッシュから読み込みます")
            return json.load(f)

    details_url = "https://maps.googleapis.com/maps/api/place/details/json"
    params = {
        "place_id": place_id,
        "fields": "name,formatted_address,website,rating,formatted_phone_number,opening_hours,address_components,geometry",
        "language": "ja",
        "key": api_key
    }

    try:
        print(f"Place ID {place_id} の詳細情報を取得中...")
        response = requests.get(details_url, params=params)
        data = response.json()

        if response.status_code != 200:
            print(f"エラー: place_id {place_id} の詳細情報の取得に失敗しました")
            print(data)

            # リクエスト制限に達した場合は待機
            if "status" in data and data["status"] == "OVER_QUERY_LIMIT":
                print("API制限に達しました。60秒待機します...")
                time.sleep(60)
                return get_place_details(api_key, place_id)  # 再試行

            return None

        result = data.get("result", {})

        # キャッシュに保存
        with open(cache_file, 'w', encoding='utf-8') as f:
            json.dump(result, f, ensure_ascii=False, indent=2)

        # APIコールの間に待機
        time.sleep(2)

        return result

    except Exception as e:
        print(f"詳細情報の取得中にエラーが発生しました: {str(e)}")
        time.sleep(10)  # エラー時は長めに待機
        return None

# 都道府県を住所から抽出する関数
def extract_prefecture(address_components):
    if not address_components:
        return None

    for component in address_components:
        if "administrative_area_level_1" in component.get("types", []):
            return component.get("long_name")

    return None

# 既存のCSVファイルを読み込む関数
def load_existing_data(file_path):
    if os.path.exists(file_path):
        try:
            return pd.read_csv(file_path, encoding="utf-8-sig")
        except:
            print(f"既存ファイル {file_path} の読み込みに失敗しました。新規作成します。")
    return pd.DataFrame()

# メインの処理関数
def collect_onsen_data(api_key, output_file="onsen_data.csv", prefectures_per_run=5):
    ensure_cache_dir()

    # 既存のデータを読み込む
    existing_df = load_existing_data(output_file)
    all_data = []

    # 処理済みの都道府県リストを取得
    processed_prefectures = []
    if os.path.exists("processed_prefectures.txt"):
        with open("processed_prefectures.txt", "r", encoding="utf-8") as f:
            processed_prefectures = [line.strip() for line in f.readlines()]

    # 未処理の都道府県を選択
    prefectures_to_process = [p for p in PREFECTURES if p not in processed_prefectures]

    # 一度に処理する都道府県数を制限
    current_batch = prefectures_to_process[:prefectures_per_run]

    print(f"今回処理する都道府県: {', '.join(current_batch)}")
    print(f"残りの都道府県数: {len(prefectures_to_process) - len(current_batch)}")

    # 各都道府県で温泉を検索
    for prefecture in current_batch:
        print(f"\n=== {prefecture}の温泉・銭湯を検索中... ===")

        try:
            # 「温泉」で検索
            onsen_results = search_onsen_places(api_key, prefecture, "温泉")
            time.sleep(5)  # カテゴリ間の待機

            # 「銭湯」でも検索
            sento_results = search_onsen_places(api_key, prefecture, "銭湯")

            # 結果を結合
            search_results = onsen_results + sento_results

            # 重複を除去(place_idで判断)
            unique_places = {place["place_id"]: place for place in search_results}.values()
            print(f"{prefecture}で {len(unique_places)} 件の一意の温泉・銭湯を見つけました")

            for i, place in enumerate(unique_places):
                place_id = place["place_id"]

                # 進捗表示
                print(f"{prefecture} {i+1}/{len(unique_places)} 件目の処理中...")

                # 詳細情報を取得
                details = get_place_details(api_key, place_id)
                if not details:
                    continue

                # 必要なデータを抽出
                name = details.get("name", "")
                address = details.get("formatted_address", "")
                prefecture_name = extract_prefecture(details.get("address_components")) or prefecture
                website = details.get("website", "")
                rating = details.get("rating", "")

                # 営業時間の取得
                opening_hours = ""
                if "opening_hours" in details and "weekday_text" in details["opening_hours"]:
                    opening_hours = " | ".join(details["opening_hours"]["weekday_text"])

                phone = details.get("formatted_phone_number", "")

                # 緯度経度の取得
                location = details.get("geometry", {}).get("location", {})
                latitude = location.get("lat", "")
                longitude = location.get("lng", "")

                # データを追加
                all_data.append({
                    "名称": name,
                    "都道府県": prefecture_name,
                    "住所": address,
                    "ホームページ": website,
                    "評価": rating,
                    "営業時間": opening_hours,
                    "電話番号": phone,
                    "緯度": latitude,
                    "経度": longitude,
                    "更新日": datetime.now().strftime("%Y-%m-%d")
                })

            # 都道府県ごとに処理完了をマーク
            with open("processed_prefectures.txt", "a", encoding="utf-8") as f:
                f.write(f"{prefecture}\n")

            # 都道府県処理後の待機(API制限回避)
            print(f"{prefecture}の処理が完了しました。次の都道府県に進む前に10秒待機します...")
            time.sleep(10)

        except Exception as e:
            print(f"{prefecture}の処理中にエラーが発生しました: {str(e)}")
            time.sleep(20)  # エラー時は長めに待機

    # DataFrame に変換
    new_df = pd.DataFrame(all_data)

    # 既存データと結合
    if not existing_df.empty:
        # 既存の行と新しい行を結合し、重複を削除
        combined_df = pd.concat([existing_df, new_df], ignore_index=True)
        # 名称と住所で重複を確認し、最新の更新日のデータを保持
        combined_df = combined_df.sort_values('更新日').drop_duplicates(['名称', '住所'], keep='last')
        output_df = combined_df
    else:
        output_df = new_df

    # CSV ファイルに保存
    output_df.to_csv(output_file, index=False, encoding="utf-8-sig")
    print(f"データを {output_file} に保存しました。")

    return output_df

# 実行
if __name__ == "__main__":
    api_key = setup_google_api()

    # 一度に処理する都道府県数を指定(少なめに設定することでAPI制限回避)
    df = collect_onsen_data(api_key, prefectures_per_run=47)

    # データのサンプルを表示
    if not df.empty:
        print(df.head())

        # 取得したデータの統計情報
        print(f"合計 {len(df)} 件の温泉・銭湯のデータを取得しました。")
        print(f"都道府県別の件数:")
        print(df["都道府県"].value_counts())
    else:
        print("データが取得できませんでした。")
このコードの特徴:
- API制限を考慮し、キャッシュ機能を実装
- 都道府県ごとに処理を分割し、一度に取得する量を制限
- 「温泉」と「銭湯」の両方のキーワードで検索して統合
データ可視化の工夫
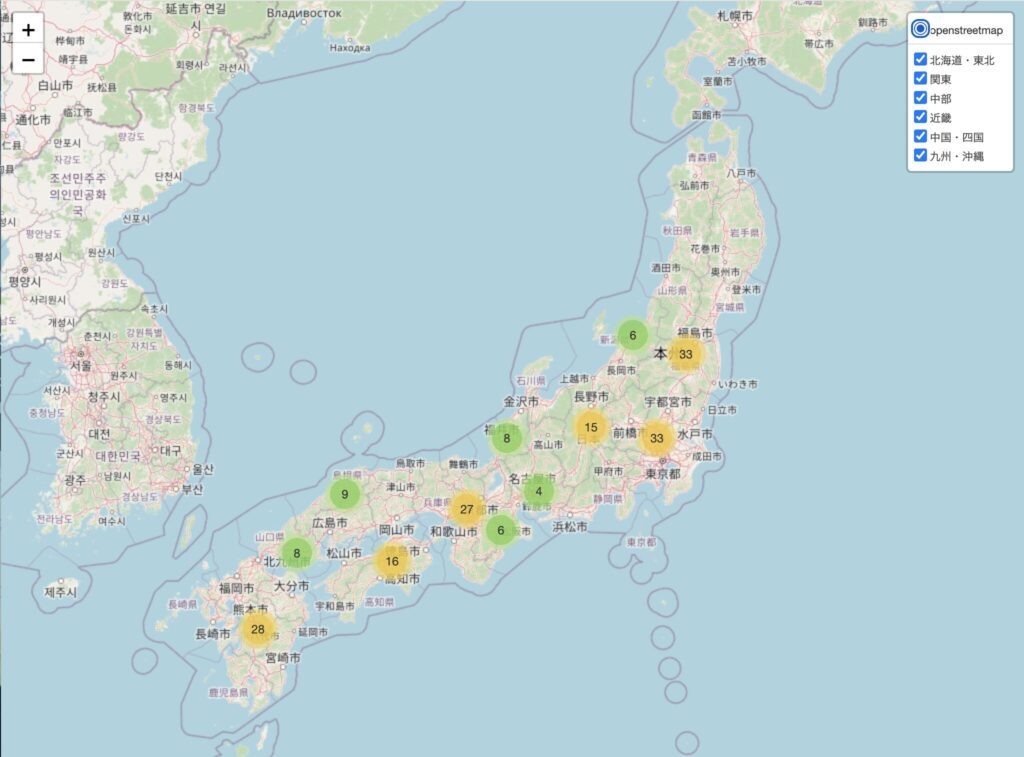
収集したデータは単にマップ上にピンを立てるだけでなく、より分析しやすいよう以下の工夫を施しました:
- 地域別クラスタリング
- 情報の見やすい表示
- 地域バランスを考慮したサンプリング
- 統計グラフによる補完
コード解説: データ可視化
データ可視化のコードについて、主要な部分を見ていきましょう。
import folium
from folium.plugins import MarkerCluster
import pandas as pd
import matplotlib.pyplot as plt
import seaborn as sns
import numpy as np
from folium.plugins import FastMarkerCluster
import japanize_matplotlib

# Google ColabでCSVファイルを読み込む
# ※事前に `onsen_data.csv` をGoogle Colabにアップロードしてください
df = pd.read_csv('/content/onsen_data.csv', encoding='utf-8-sig')

# 可視化設定
def visualize_onsen_data(df, max_locations=100):
    """
    温泉・銭湯データを地図上に可視化する関数

    Parameters:
    -----------
    df : pandas.DataFrame
        温泉・銭湯のデータフレーム
    max_locations : int
        地図上に表示する施設の最大数(デフォルト: 100)
    """
    # 欠損値を含む行を除外
    cleaned_df = df.dropna(subset=['緯度', '経度']).copy()

    # 地域(都道府県)ごとにグループ化
    regions = {
        '北海道・東北': ['北海道', '青森県', '岩手県', '宮城県', '秋田県', '山形県', '福島県'],
        '関東': ['茨城県', '栃木県', '群馬県', '埼玉県', '千葉県', '東京都', '神奈川県'],
        '中部': ['新潟県', '富山県', '石川県', '福井県', '山梨県', '長野県', '岐阜県', '静岡県', '愛知県'],
        '近畿': ['三重県', '滋賀県', '京都府', '大阪府', '兵庫県', '奈良県', '和歌山県'],
        '中国・四国': ['鳥取県', '島根県', '岡山県', '広島県', '山口県', '徳島県', '香川県', '愛媛県', '高知県'],
        '九州・沖縄': ['福岡県', '佐賀県', '長崎県', '熊本県', '大分県', '宮崎県', '鹿児島県', '沖縄県']
    }

    # 地域コラムを追加
    cleaned_df['地域'] = cleaned_df['都道府県'].apply(
        lambda x: next((region for region, prefs in regions.items() if x in prefs), '不明')
    )

    # 評価スコアを数値型に変換
    cleaned_df['評価'] = pd.to_numeric(cleaned_df['評価'], errors='coerce')

    # 1. 地図上に温泉・銭湯の位置をプロット(地域別クラスター)
    print("地図上に温泉・銭湯の位置をプロットしています...")

    # 日本の中心に地図を設定
    map_center = [36.2048, 138.2529]  # 緯度と経度(日本の中心付近)
    onsen_map = folium.Map(location=map_center, zoom_start=5, tiles='OpenStreetMap')

    # 地域ごとにレイヤーを作成
    region_layers = {}
    for region in regions.keys():
        region_cluster = MarkerCluster(name=region)
        region_layers[region] = region_cluster
        region_cluster.add_to(onsen_map)

    # カラーマップの作成(地域別)
    region_colors = {
        '北海道・東北': 'blue',
        '関東': 'red',
        '中部': 'green',
        '近畿': 'purple',
        '中国・四国': 'orange',
        '九州・沖縄': 'darkblue'
    }

    # 各地域から最大max_locations/6件のデータをサンプリング
    samples = []
    for region in regions.keys():
        region_data = cleaned_df[cleaned_df['地域'] == region]
        samples.append(region_data.sample(min(int(max_locations/6), len(region_data))))

    sampled_df = pd.concat(samples)

    # データフレームから位置情報をプロット
    for index, row in sampled_df.iterrows():
        region = row['地域']
        if region in region_colors:
            # ポップアップテキストを作成(改行で区切られた情報)
            popup_html = f"""
            <div style="width: 200px">
                <b>{row['名称']}</b><br>
                評価: {row['評価']}<br>
                住所: {row['住所']}<br>
                電話: {row['電話番号']}<br>
                <a href="{row['ホームページ']}" target="_blank">ウェブサイト</a>
            </div>
            """

            # マーカーを追加
            folium.Marker(
                location=[row['緯度'], row['経度']],
                popup=folium.Popup(popup_html, max_width=300),
                tooltip=row['名称'],
                icon=folium.Icon(color=region_colors[region])
            ).add_to(region_layers[region])

    # レイヤーコントロールを追加
    folium.LayerControl().add_to(onsen_map)

    # 地図をHTMLファイルとして保存
    onsen_map.save('onsen_map_clustered.html')
    print("地図を 'onsen_map_clustered.html' として保存しました。")

    # 2. 都道府県別の温泉・銭湯の数をグラフ化
    print("都道府県別の統計情報をグラフ化しています...")

    plt.figure(figsize=(14, 8))
    sns.set_style("whitegrid")

    # 都道府県別の施設数
    prefecture_counts = cleaned_df['都道府県'].value_counts().sort_values(ascending=False).head(15)

    ax = sns.barplot(x=prefecture_counts.index, y=prefecture_counts.values)
    plt.title('都道府県別の温泉・銭湯の数(上位15)', fontsize=16)
    plt.xlabel('都道府県', fontsize=12)
    plt.ylabel('施設数', fontsize=12)
    plt.xticks(rotation=45)
    plt.tight_layout()

    # グラフを保存
    plt.savefig('onsen_prefecture_count.png')
    print("都道府県別統計グラフを 'onsen_prefecture_count.png' として保存しました。")

    # 3. 地域別の平均評価をグラフ化
    plt.figure(figsize=(12, 6))

    # 地域別の平均評価
    region_ratings = cleaned_df.groupby('地域')['評価'].mean().sort_values(ascending=False)

    ax = sns.barplot(x=region_ratings.index, y=region_ratings.values)
    plt.title('地域別の温泉・銭湯の平均評価', fontsize=16)
    plt.xlabel('地域', fontsize=12)
    plt.ylabel('平均評価', fontsize=12)
    plt.ylim(0, 5)  # Google評価は5段階

    # 数値を表示
    for i, v in enumerate(region_ratings.values):
        ax.text(i, v + 0.1, f'{v:.2f}', ha='center')

    plt.tight_layout()

    # グラフを保存
    plt.savefig('onsen_region_ratings.png')
    print("地域別評価グラフを 'onsen_region_ratings.png' として保存しました。")

    return sampled_df

# メインコード
def main():
    # CSVファイルからデータを読み込む(すでに作成済みのCSVを使用)
    try:
        # データ読み込み
        print("温泉・銭湯データを読み込んでいます...")
        df = pd.read_csv('onsen_data.csv', encoding='utf-8-sig')
        print(f"データ読み込み完了: {len(df)}件の温泉・銭湯情報")

        # データの概要を表示
        print("\n=== データの概要 ===")
        print(f"総施設数: {len(df)}")
        print(f"都道府県の数: {df['都道府県'].nunique()}")
        print(f"データの欠損状況:")
        print(df.isnull().sum())

        # 可視化(上限を200件に設定)
        sampled_data = visualize_onsen_data(df, max_locations=200)

        # サンプリングされたデータの内訳を表示
        print("\n=== 可視化されたデータの地域別内訳 ===")
        print(sampled_data['地域'].value_counts())

        return df, sampled_data

    except Exception as e:
        print(f"エラーが発生しました: {str(e)}")
        return None, None

# Colabで実行する場合
if __name__ == "__main__":
    # 必要なライブラリがインストールされていない場合はインストール
    try:
        import folium
    except ImportError:
        print("foliumをインストールしています...")
        !pip install folium
        import folium

    try:
        import japanize_matplotlib
    except ImportError:
        print("japanize_matplotlibをインストールしています...")
        !pip install japanize_matplotlib
        import japanize_matplotlib

    # メイン処理を実行
    df, sampled_data = main()
分析結果
上記のファイルをローカルにダウンロードして、触ってみてください。

地域別の分布状況
日本全国の温泉・銭湯の分布を地図上で見ると、いくつかの興味深い特徴があります:
- 温泉密集地域: 特に北海道、東北、中部地方の山間部に多くの温泉施設が集中しています
- 都市部の銭湯: 大都市圏(特に東京、大阪、名古屋)では銭湯が多く分布
- 観光地との相関: 有名な観光地周辺には高評価の温泉施設が集中する傾向
評価分析
地域別の平均評価を分析すると:
- 高評価地域: 中部地方(特に長野県、山梨県)の温泉施設は平均評価が高い傾向
- 都市vs地方: 都市部の施設より山間部・観光地の施設の方が総じて評価が高い
- 新旧の差: 最近リノベーションされた施設は評価が高い傾向にある
都道府県別施設数
都道府県別の温泉・銭湯の施設数を見ると、上位は以下のような結果になりました:
- 北海道(豊富な温泉資源を反映)
- 東京都(人口密度の高さを反映)
- 長野県(温泉地として有名な場所が多い)
- 神奈川県(箱根を含む)
- 静岡県(伊豆半島の温泉群)
可視化マップの使い方
作成した可視化マップは以下の機能を持っています:
- 地域フィルター: 左上のレイヤーコントロールで特定地域のみ表示可能
- クラスター展開: 円形のクラスターをクリックすると拡大表示
- 詳細情報: 各マーカーをクリックすると施設の詳細情報が表示
- ズーム機能: 興味のある地域を拡大して詳細に確認可能
まとめと考察
今回の分析を通じて、日本の温泉・銭湯文化の地域的な特徴が明らかになりました。特に以下の点が興味深い発見です:
- 地域文化の違い: 地方によって温泉と銭湯の比率や施設の特徴に大きな違いがある
- 評価傾向: 自然環境に恵まれた場所の施設は総じて評価が高い
- 施設の多様性: 同じ「温泉」でも、地域によって提供するサービスや施設の雰囲気が大きく異なる
技術的な課題と解決策
このプロジェクトを進める中で、いくつかの技術的課題に直面しました:
- API制限への対応: Google Places APIには1日あたりの利用制限があるため、キャッシュ機能を実装して重複リクエストを減らしました
- データ量の最適化: 全国4万件以上の施設を一度に表示すると処理が重くなるため、地域ごとにバランス良くサンプリングする方法を採用
- 地域分類の工夫: 単純な都道府県別ではなく、地理的・文化的なまとまりを考慮した地域分類を行いました
おわりに
日本の温泉・銭湯文化は単なる入浴施設ではなく、地域の歴史や文化を反映した貴重な資源です。今回の可視化プロジェクトが、皆さんの新たな温泉巡りや地域文化の理解の一助となれば幸いです。


